Eight options-derived levels. One TradingView overlay.
Weekly & Daily Expected Move (±1σ), CALL/CALL+ resistance, PUT/PUT+ support, Gamma Flip, GEX peak, VOL strike — all sourced from live options data and plotted directly on your chart across the major US tickers traders actually trade.
$14.99/month or $149/year. Cancel anytime — one click, no questions.
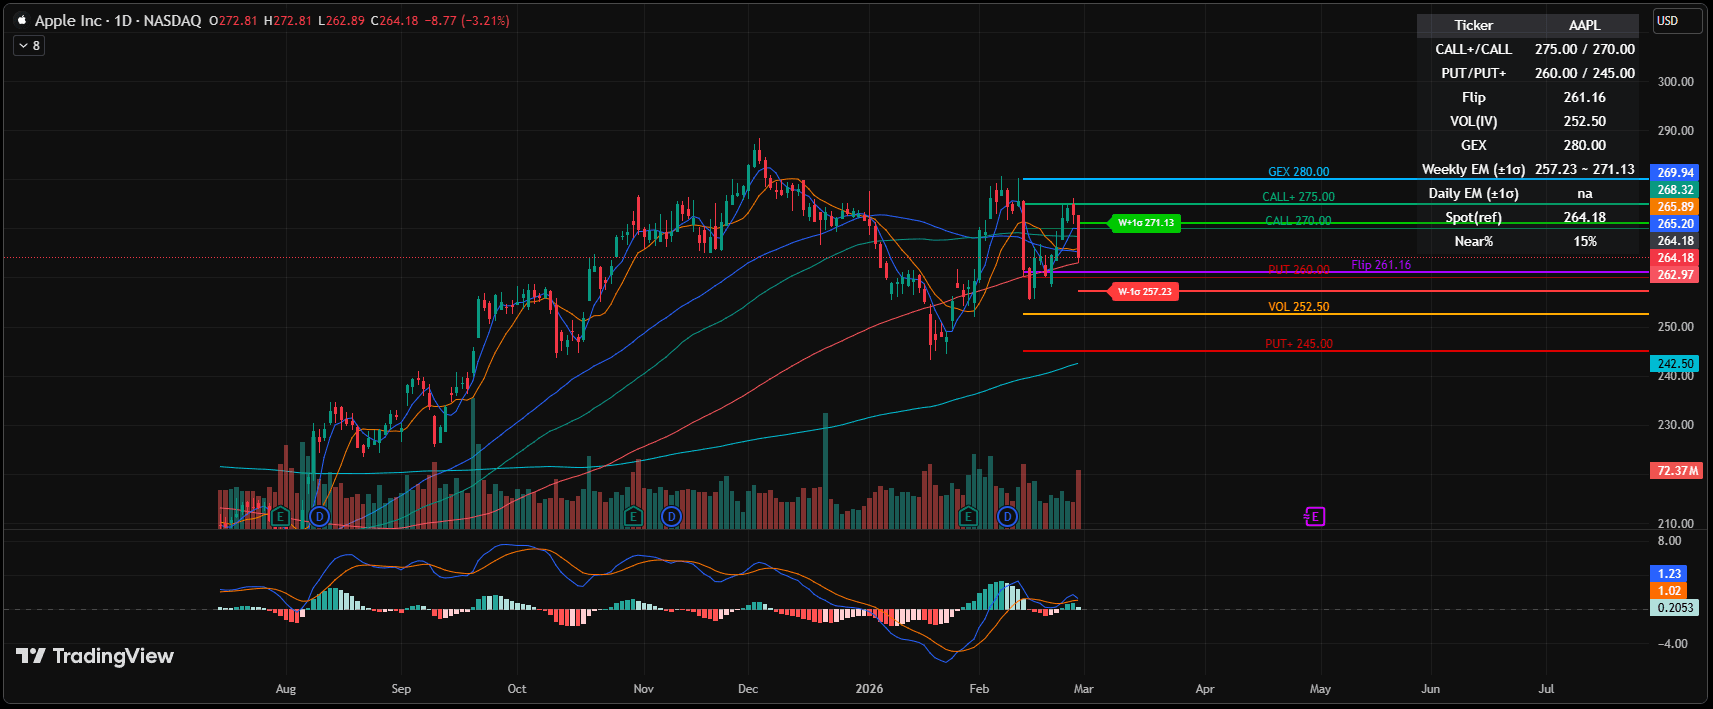
AAPL Daily — all 8 levels plotted live. Dashboard on the right tracks every value with the spot reference.
Every level the options market actually defends.
Most indicators describe what price already did. These describe where dealers are positioned — the levels that move price next.
Weekly Expected Move
The ~68% probability range for the week, derived from at-the-money IV. Refreshed every Friday close.
Daily Expected Move
0DTE / next-session range from the closest expiry's IV. Built for day-trade sizing and stop placement.
Outer Call Wall
The far OI cluster above spot — the level dealer gamma defends hardest when price tries to break out.
Near Call Wall
The first concentrated short-gamma resistance overhead — usually where rallies pause.
Near Put Wall
The first major OI floor below spot — dealer hedging tends to absorb selloffs here.
Outer Put Wall
The deep support cluster — where forced hedging accelerates and reversals tend to form.
Gamma Flip
The strike where dealer net gamma crosses zero. Above = vol suppressed. Below = vol amplifies.
GEX Peak
Strike with the largest gamma exposure — the price magnet on pin days, especially near expiry.
From signup to first chart in under 5 minutes
Subscribe
Enter email + your TradingView username. Stripe Checkout, 14-day trial — no charge until day 15.
We grant access
Your TV username is added to the invite-only indicator within a few hours (we do this by hand).
Add to chart
Open TradingView → Indicators → Invite-only — you'll see 'Sigma levels + Option Walls by US Stock Sigma'.
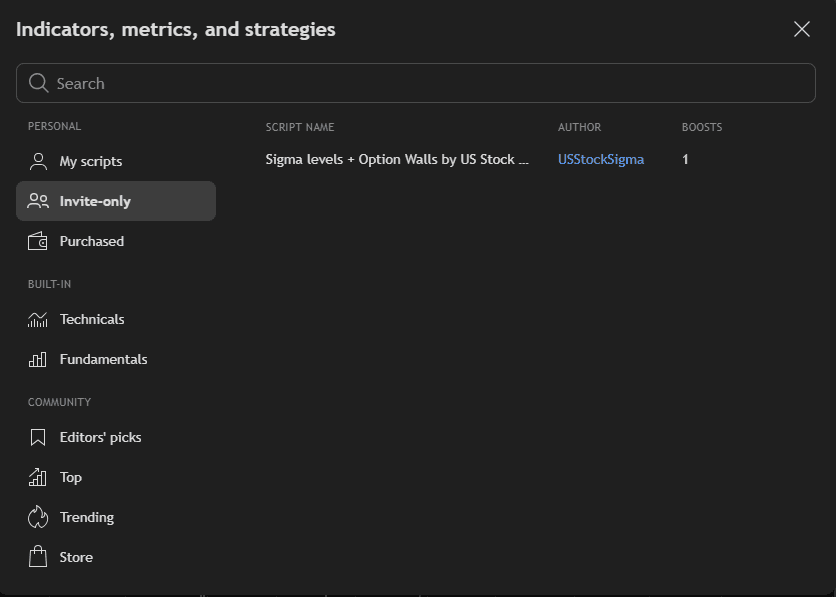
That's the exact tab and listing you'll see after access is granted.
The math, in one line.
Weekly and Daily ±1σ are computed directly from at-the-money implied volatility — the price the market is currently paying for protection. No proprietary smoothing, no curve-fitting, no "secret sauce."
- →Walls come from open interest concentration at each expiry — the strikes dealers are short and must hedge.
- →Flip is the strike where aggregate dealer gamma crosses zero — the regime line between suppression and amplification.
- →GEX peak is the strike with the largest absolute gamma exposure — the gravitational center on pin days.
The tickers traders actually trade.
Major indices, mega-caps, the high-volume semis, the AI / nuclear / crypto names retail follows, and the broad sector ETFs. A few examples from each family:
Don't see your ticker? We add new symbols on request based on options liquidity — message usstocksigma@gmail.com.
One flat price. Cancel whenever.
$14.99/month — or save 17% with annual ($149/year). 14-day free trial included.