US Stock Sigma

Sigma levels + Option Walls

One indicator. Eight options-derived levels. Every metric the right-side dashboard tracks is plotted on the chart so you can read positioning without leaving TradingView.

AAPL Daily — all 8 levels plotted: Weekly EM ±1σ, CALL+, CALL, PUT, PUT+, Flip, GEX, VOL — with the right-side dashboard.

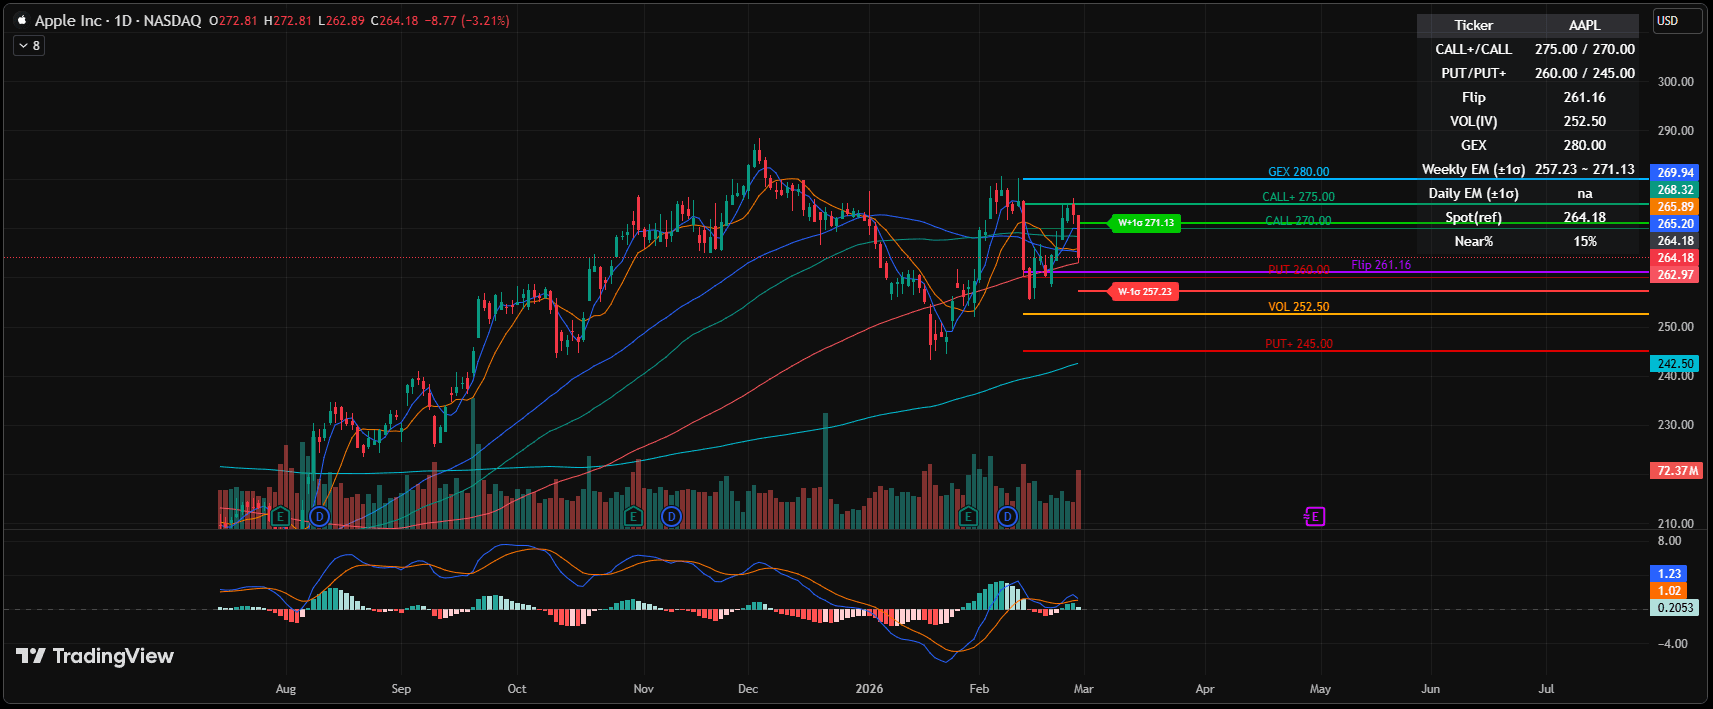
AAPL Daily — every level on the dashboard is drawn on the chart at the same time.

The eight levels — and what each one tells you.

Every level on the indicator is derived from observable options market data — open interest, implied volatility, gamma exposure — not from price-only patterns or proprietary smoothing.

W ±1σ

Weekly Expected Move

The statistical price range — approximately ±1 standard deviation — implied by at-the-money options for the upcoming week.

Where is the week's statistical extreme? When the market gets there, the options chain says you're in the 1-in-3 tail.

Formula: Spot × IV × √(t / 365)Refreshed every Friday after the cash close.
D ±1σ

Daily Expected Move

Same calculation as Weekly, but applied to the closest expiry — typically the next session or 0DTE.

What's a realistic intraday range for sizing day-trades and placing stops outside the noise?

Formula: Spot × IV × √(t / 365) (t in days, typically 1)Refreshed before each session where a near-term expiry exists.
CALL+

Outer Call Wall

The strike further above spot with a major short-call open-interest concentration.

If we break the near wall, where does dealer hedging defend next? CALL+ is the deeper line of defense.

CALL

Near Call Wall

The closest strike above spot with concentrated call open interest — typically the first place rallies pause.

What's the immediate ceiling? Above it usually requires fresh news; below it the market churns.

PUT

Near Put Wall

The closest strike below spot with concentrated put open interest — the first major support.

Where do dealers absorb the first wave of selling? Drops here often pause before continuing.

PUT+

Outer Put Wall

The deeper strike below spot with major put open interest — the level reversals form against.

If support breaks, where does forced hedging accelerate? PUT+ is the wash-out zone.

FLIP

Gamma Flip

The strike where aggregate dealer net gamma crosses from positive to negative.

What regime are we in right now? Above Flip = vol suppressed (dealers buy dips, sell rips). Below Flip = vol amplified (dealers chase, ranges expand).

GEX

GEX Peak

The single strike with the largest absolute gamma exposure across the expiry stack.

Where's the magnet on pin days — especially Wednesday/Friday near OPEX? Price tends to gravitate here at expiry.

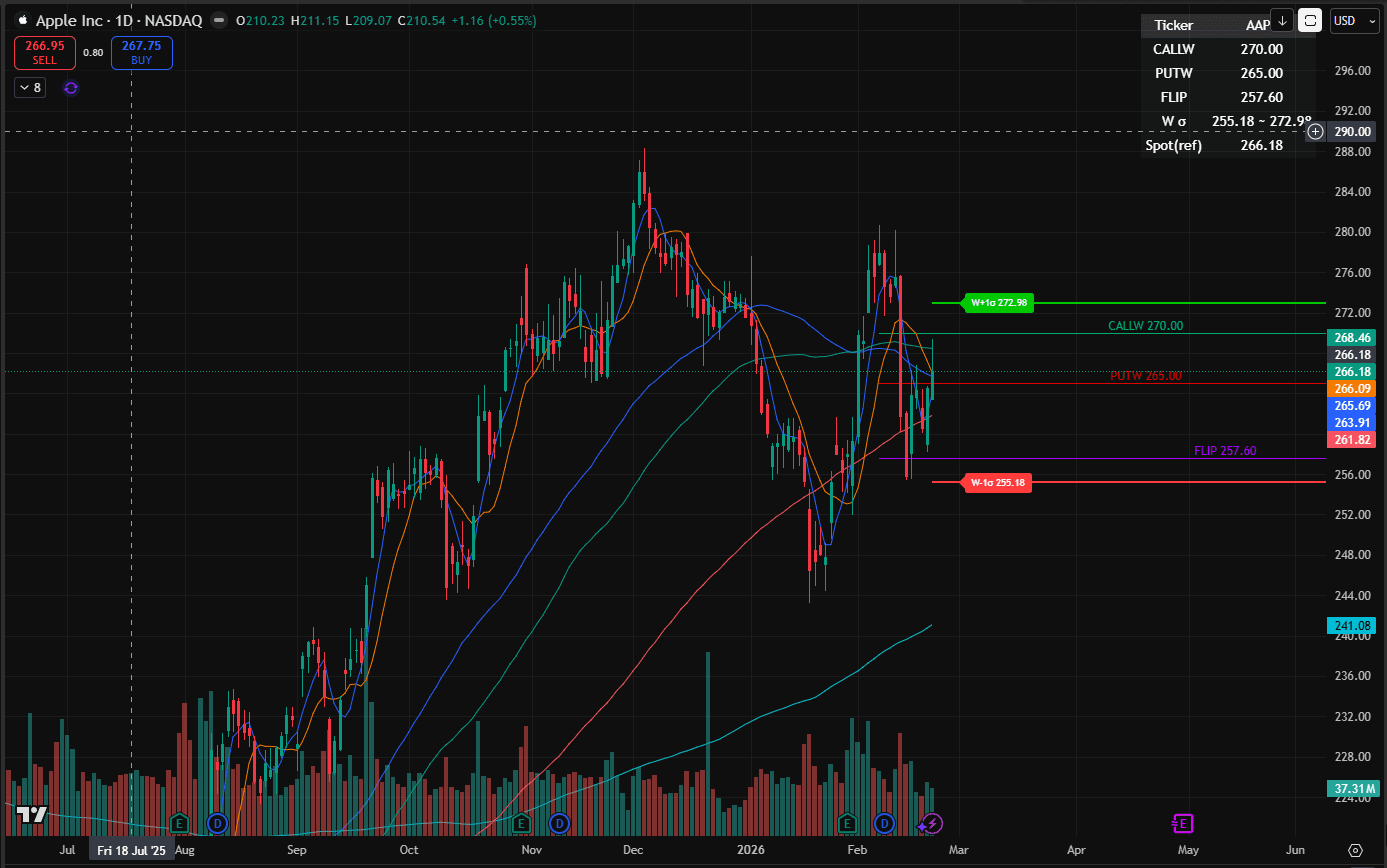
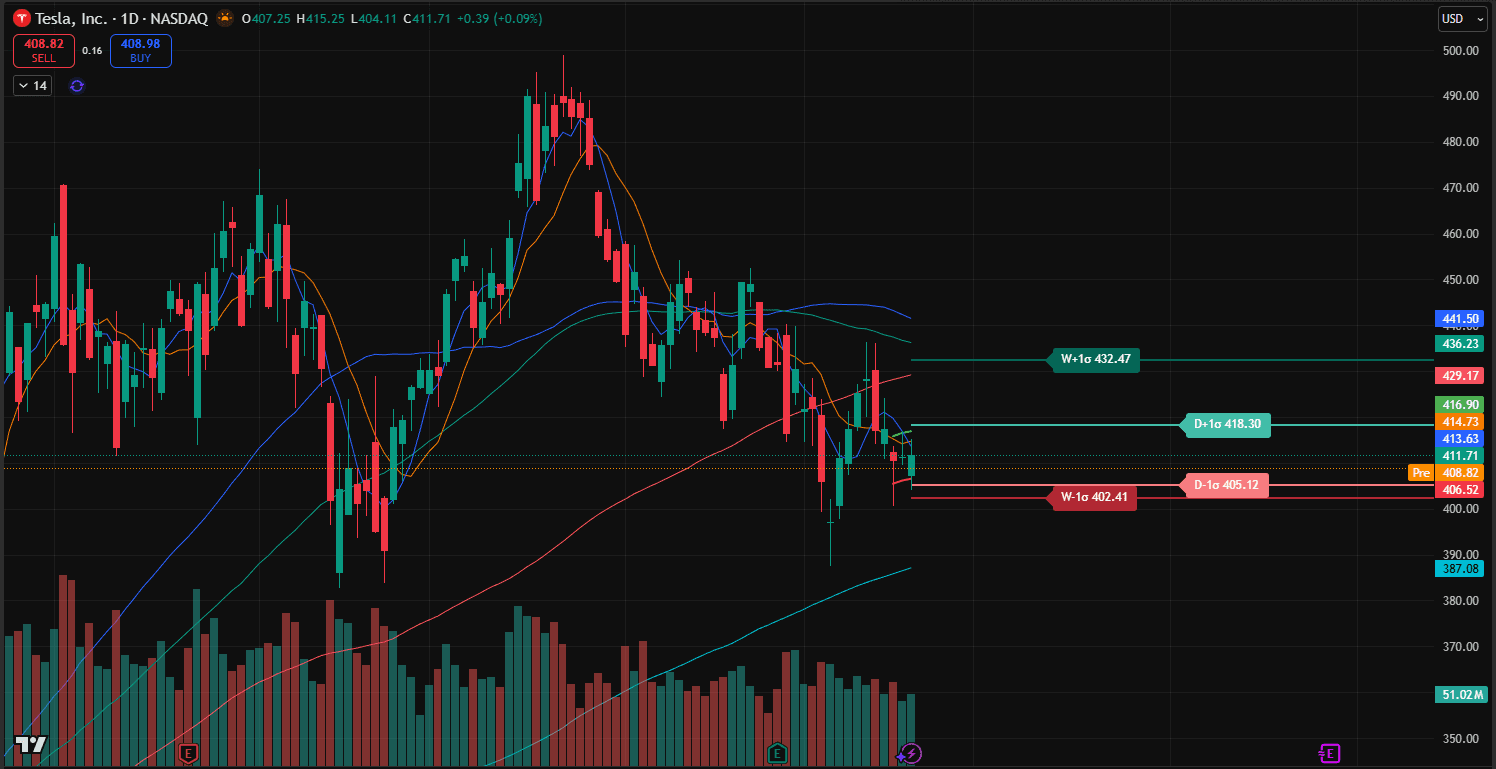
Same overlay, every ticker.

The indicator behaves identically across mega-caps, semis, and indices — the only thing that changes is the data the options chain hands it.

AAPL Daily with CALL Wall, PUT Wall, FLIP line, and Weekly ±1σ envelope highlighted.
AAPL — the immediate trading range is bracketed by CALLW 270 / PUTW 265, with Weekly ±1σ at 272.98 / 255.18 marking the statistical extreme. FLIP at 257.60 is the regime line just below current spot.
TSLA Daily with Weekly ±1σ and Daily ±1σ envelopes stacked simultaneously.
TSLA — Daily ±1σ (405.12 / 418.30) sits inside the wider Weekly band (402.41 / 432.47), letting you sandbox intraday risk against the broader weekly map.
META Daily with the Sigma levels + Option Walls [Lite] view showing CALL Wall, PUT Wall, FLIP, and Weekly ±1σ.
META — a cleaner "Lite" view focused on Walls + ±1σ for traders who want the map without the full dashboard.

How the data gets to your chart.

No black box. Every number on the indicator can be traced back to a live options chain and a published formula.

STEP 1

Live options chains

Pulled from a Tradier production API across every covered ticker.

STEP 2

Sheet normalization

Spot, IV, OI, gamma — written into a Google Sheet pipeline that handles batching, retries, and quota management.

STEP 3

Sigma + Wall computation

±1σ ranges, Wall strikes, Flip, GEX peak — derived deterministically from the normalized data.

STEP 4

Pushed to Pine

Levels emitted into the TradingView indicator weekly (Friday close). Click 'Update' in TV to pull the latest.

Simple, honest pricing

14-day free trial on every plan. Cancel before the trial ends and pay nothing.

Monthly

$14.99/ month

Flexibility — cancel any month

Start Free Trial
Best value

Annual

$149/ year

Save 17% — equivalent to $12.42/mo

Start Free Trial

All prices in USD. Billed after the 14-day trial. Existing customers who subscribed at our previous $9.99/month rate keep their original pricing — your loyalty is rewarded.

Frequently asked questions

What exactly is an Expected Move?
Expected Move is the statistical price range implied by at-the-money options for a given period. The ±1σ band represents roughly 68% probability — it's a probabilistic reference, not a guarantee. Markets routinely test or exceed the band on news and macro events.
What's the difference between CALL/PUT and CALL+/PUT+?
CALL and PUT are the closest concentrated open-interest walls above and below spot — the immediate ceiling and floor. CALL+ and PUT+ are the next ring out — the deeper defenses dealers fall back to if the near wall breaks. You read the chart as: spot bracketed by inner walls (CALL / PUT), with outer walls (CALL+ / PUT+) marking the statistical extreme of the move.
What does the Gamma Flip line do for me?
It's a regime indicator. Above Flip, dealers are net long gamma and tend to suppress volatility (buy dips, sell rips). Below Flip, dealers are net short gamma and tend to amplify moves (chase strength, dump weakness). Knowing which side of Flip you're on tells you whether to expect mean-reverting or trending behavior.
How fast do I get TradingView access?
Up to 24 hours, usually much faster. After Stripe Checkout completes, your TradingView username is added to the invite-only indicator by hand. You'll get a confirmation email once it's active.
When is data refreshed?
Weekly Expected Move and Wall levels refresh every Friday after the cash close. Daily ±1σ (where the ticker has a near-term expiry) refreshes before the next session. Click the 'Update' icon on the indicator in TradingView to pull the latest values.
Can I share my access with someone else?
No. Subscriptions are tied to the single TradingView username you provide at signup. Account sharing, redistribution, or resale of the indicator is prohibited and will result in cancellation without refund.
What's your refund policy?
Cancel any time during the 14-day trial and pay nothing. After billing starts, refunds aren't provided — but you can cancel immediately to prevent the next billing cycle. Access continues through the current period.
Why is the English site priced differently than the Korean one?
The English version (en.usstocksigma.com) is a separate service with English support, English documentation, and an annual plan. The Korean version (usstocksigma.com) serves the Korean market at its original pricing. Existing customers on either side keep their original rate.
Does every ticker get all 8 levels?
Most tickers carry the full set — option walls (CALL+/CALL/PUT/PUT+/FLIP/GEX/VOL) plus Weekly Expected Move. Some carry only one half because their options chain doesn't reliably support the other. The ticker either has the level or it doesn't; nothing is interpolated.
Do you offer custom ticker requests?
Yes — email usstocksigma@gmail.com. We add tickers based on subscriber demand and options market liquidity (a ticker needs a reasonably active options chain for the levels to mean anything).
Is this financial advice?
No. US Stock Sigma is a reference layer showing statistical ranges and option positioning. It is not buy/sell signals. You are solely responsible for your trading decisions. See the Disclaimer and Risk Disclosure.

Try it free for 14 days.

No commitment. Cancel anytime. Your card is charged only if you stay.